Table of Contents
- 13.1. Tungsten Dashboard User Interface Overview
- 13.2. Dashboard Navigation Bar One
- 13.3. Dashboard Navigation Bar Two
- 13.4. Dashboard Navigation Bar Three
- 13.5. Dashboard Composite Parent Row
- 13.6. Dashboard Composite Member Rows
- 13.7. Dashboard Composite Member Node Rows
- 13.8. Dashboard Standalone Cluster
This section describes all of the features and functionality available in our browser-based Graphical User Interface.
Below is a sample of how the Dashboard would look for a Composite
cluster called world with two 3-node member clusters,
called east and west:
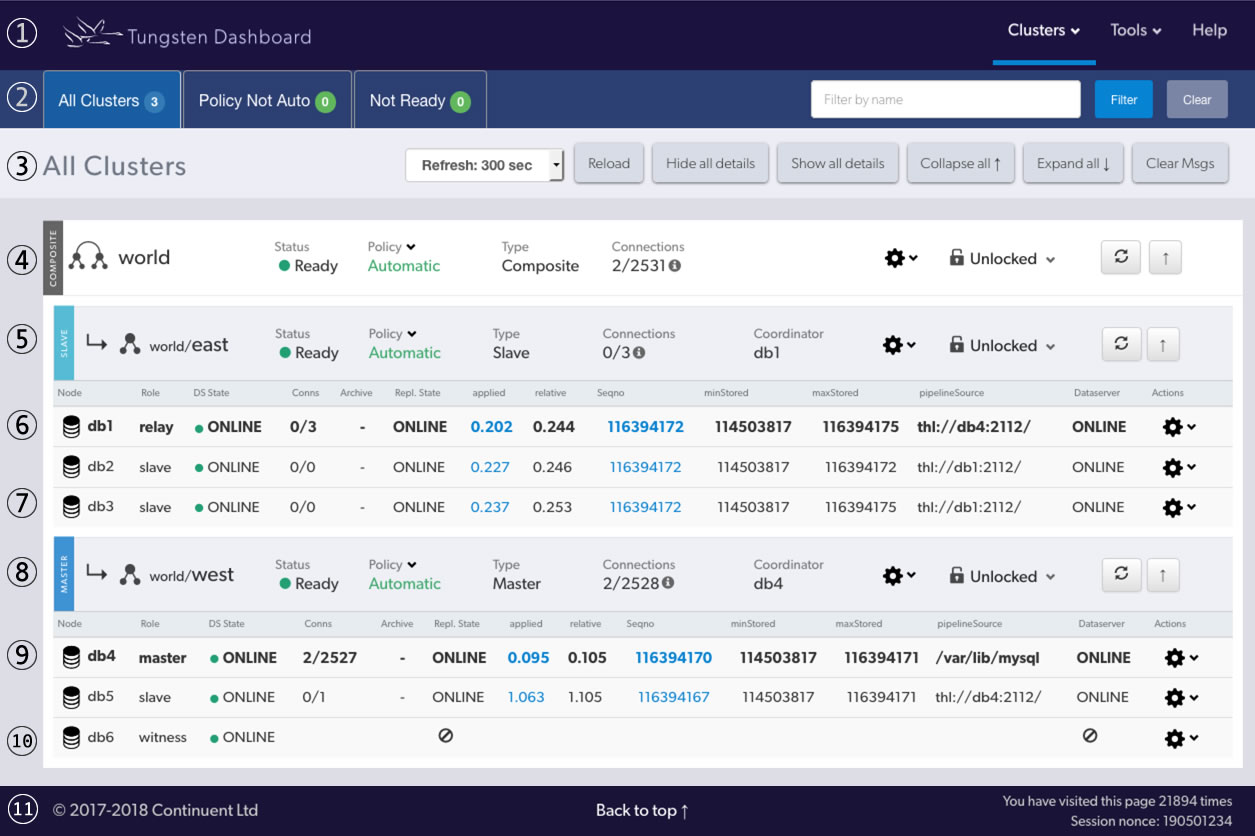
Example Composite cluster parent
worldsummary row with controlsExample Composite cluster member
eastsummary row with controlsExample Composite cluster member
westsummary row with controlsFooter with copyright, back-to-top link, visit count and session id
Nav Bar One is the first horizontal bar across the top of the window.

Logo and site title - click either to return to the home page (full page load)
Clusters menu - All clusters configured will be displayed in a hierachical view. Click on any onw to limit the view to that cluster. If you select a Composite cluster, the parent and all member clusters will show.
Tools menu - various links to outside resources. Custom links may be added here via the
config.jsonfile in the web root directory.Help feature - click to reveal helpful information.
Nav Bar Two is the second horizontal bar across the top of the window.

The badges for "Policy Not Auto" and "Not Ready" tabs are auto-updated via AJAX every 30 seconds independently of the Auto-Refresh setting on Navigation Bar Two.
All Clusters Tab - click to see all available clusters, same as clicking logo and site title (full page load)
Policy Not Auto Tab - click to see all only those clusters where the policy is set to other than
AUTOMATICNot Ready Tab - click to see only clusters that are not in the Ready state
Filtering feature - enter a value to search for in the cluster name. The search is case in-sensitive and has automatic wildcards on both sides of the string. Click on the Clear button to empty out the filter field.
Nav Bar Three is the third horizontal bar across the top of the window.

Content title - shows current view or filter in use
Auto-refresh feature - select a refresh rate of 0 (off), 5, 10, 30, 60, 120 or 300 seconds. This will enable AJAX-based reloads of the clusters in the content section without reloading the entire page. Look for the spinner in the refresh button per cluster when the refresh is triggered.
Reload button - same as clicking the top logo (full page load)
Hide All Details button - each database node is expandable to display all available details. This button closes them all.
Show All Details button - each database node is expandable to display all available details. This button opens them all.
Collapse All button - each Composite cluster is expandable to display all available node rows. This button closes them all.
Expand All button - each Composite cluster is expandable to display all available node rows. This button opens them all.
Clear Messages button - dismiss all messages that are showing at the top of the screen.
A composite Parent row contains controls for the entire Composite cluster.

Cluster type
compositevertical tag, resource icon and parent cluster nameComposite cluster status. The color will change based on the status. Status will be one of: Ready, Warning, or Error
Cluster Policy. One of:
AUTOMATIC,MAINTENANCEorMIXED. There is a state-sensitive dropdown menu to allow the Policy to be changed.Cluster type - one of: Standalone, Composite Active/Active (CAA) or Composite Active/Passive (CAP). Standalone has no composite child clusters. This field is a duplicate of the vertical tag at the start of field (1), above.
Connections - display the total number of active connections from all Connectors to all nodes in this specific cluster. If you hover over the info icon, you can see the full breakdown by node.
Composite actions dropdown menu - these are the same commands available when using cctrl -multi followed by use {composite_service_name_here}, i.e.:
shell>
cctrl -multi[LOGICAL] / >use world[LOGICAL] /world >{your_selected_command_here}Heartbeat (actually cluster heartbeat)
Recover
Switch - only available for CMS clusters
Failover - only available for CMS clusters
Locking status text and icon with dropdown menu to allow lock control.
Important
Under normal circumstances, you should not need to get a lock, since all operations automatically attempt to obtain a lock for efficiency purposes.
Refresh button - triggers an AJAX refresh of the parent cluster and all member clusters including all node rows. (no page load)
Collapse all in Composite cluster - hide node rows for all member clusters in this Composite.
A composite member row contains controls for all nodes in the member cluster.
Member clusters may have either the Active or Passive role.
There will be only one Active member cluster and any number of Passive member clusters.
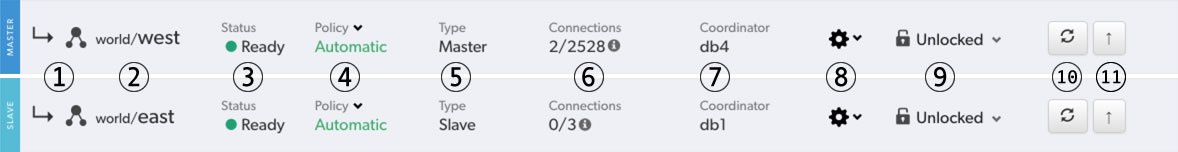
Cluster type vertical tag (
PrimaryorReplica), member cluster right-arrow indicator and cluster resource iconCluster parent service name followed by the cluster service name
Composite member cluster status. The color will change based on the status. Status will be one of: Ready, Warning, or Error
Cluster Policy. One of:
AUTOMATIC,MAINTENANCEorMIXED. There is a state-sensitive dropdown menu to allow the Policy to be changed.Cluster type - one of: Standalone, Composite, Active or Passive. Active and Passive both imply Composite membership. Standalone has no composite membership. This field is a duplicate of the vertical tag at the start of field (1), above.
Connections - display the total number of active connections from all Connectors to all nodes in the entire Composite cluster. If you hover over the info icon, you can see the full breakdown by node.
Coordinator - display the host which currently has the
coordinatorrole for the member cluster. Every cluster designates one of the Tungsten Managers in the cluster as the coordinator and it is this Manager that will be responsible for taking action, if action is required, to recover the cluster's database resources to the most highly available state possible.Cluster actions dropdown menu - there are three distinct types of choices in this dropdown menu
UI-Specific
Toggle Details - show or hide the node details for all nodes in the member cluster
Cluster-level commands
These are the same commands available when using cctrl, i.e.:
shell>
cctrl[LOGICAL] /east >{your_selected_command_here}Note
The cluster service name displayed will be the service name of the node you are logged into.
Heartbeat
Recover
Switch
Failover
Composite datasource-level commands
These are the same commands available when using cctrl -multi followed by use {composite_service_name_here}, i.e.:
shell>
cctrl -multi[LOGICAL] / >use world[LOGICAL] /world >datasource {cluster_member_service_here} {your_selected_command_here}Here are some individual examples:
[LOGICAL] /world >
datasource east recover[LOGICAL] /world >datasource west fail[LOGICAL] /world >switch to westRecover
Welcome
Online
Offline
Shun
Promote - this is the same as doing a switch to {cluster_member_service_here}
Fail
Locking status text and icon with dropdown menu to allow lock control.
Important
Under normal circumstances, you should not need to get a lock, since all operations automatically attempt to obtain a lock for efficiency purposes.
Refresh - triggers an AJAX refresh of that member cluster only (no page load)
Collapse - hide the node rows for that member cluster only
A node row contains controls for that one specific cluster node.
Cluster nodes may have one of the following roles: Primary, Replica, Witness or Standby. Composite member cluster nodes may also have the Relay role.
For any cluster, there will be only one Primary/Relay cluster node and any number of Replica nodes.
A Cluster Primary node is assigned the special role of Relay when it is part of a Composite Passive cluster.
Active witness nodes do not have a database and therefore do not run a replicator. Passive witness nodes do not appear because they have no Manager process running.
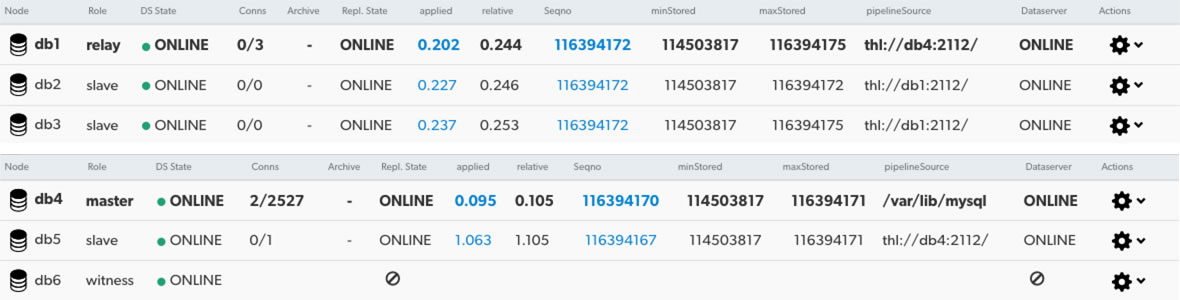
Node - the hostname of the server
Role - one of Primary, Relay, Replica, Standby or Witness
DS State - DataSource state can be
ONLINE,OFFLINE, SHUNNED or FAILED. There may be other, less-used values.Conns - number of active connections / total number of connections created since last restart
Archive - has Archive mode been enabled? See Mark a Datasource as Archive for more information.
Repl. State - the state of the Replicator process, one of:
ONLINE,OFFLINEor ERRORapplied - the
appliedLatencyvalue, which is how long it took to actually get the event either extracted from the Primaries binary logs or applied into the Replicas target databaserelative - the
relativeLatencyvalue, which is how long it has been since we performed an actionSeqno - the
appliedLastSeqnovalueminStored - the
minimumStoredSeqNovalue, which is the sequence number of the oldest event stored in the THLmaxStored - the
maximumStoredSeqNovalue, which is the sequence number of the latest event to be stored in the THLpipelineSource- the protocol, host and port where the replicator is pulling THL fromDataserver - the state of the database server, one of
ONLINE,OFFLINEor UNKNOWNActions - the node-specifc commands dropdown menu. There are four distinct types of choices in this dropdown menu.
UI-Specific
For all nodes that have a running Replicator, the installed Tungsten version will be the first item visible.
Toggle Details - show or hide the node details for that specific node
DataSource (Node-level) Commands
These are the same commands available when using cctrl, i.e.:
shell>
cctrl[LOGICAL] /east >datasource {node_hostname_here} {your_selected_command_here}Note
The cluster service name displayed will be the service name of the node you are logged into.
Replicator-specific DataSource (Node-level) Commands
These are the same commands available when using cctrl, i.e.:
shell>
cctrl[LOGICAL] /east >replicator {node_hostname_here} {your_selected_command_here}Here are some individual examples:
[LOGICAL] /world >
replicator db1 online[LOGICAL] /world >replicator db3 offlineReplica-specific DataSource (Node-level) Commands
Important
These are commands are ONLY available on a node with the Replica or Standby roles. Nodes with either Primary, Relay or Witness roles will not display the Replica-specific menu options.
These are the same commands available when using cctrl, i.e.:
shell>
cctrl[LOGICAL] /east >datasource {node_hostname_here} {your_selected_command_here}Here are some individual examples:
[LOGICAL] /world >
datasource db1 shun[LOGICAL] /world >datasource db3 recover[LOGICAL] /world >switch to db2Backup
Restore
Shun
Enable Standby
Disable Standby
Promote - this is the same as doing a switch to {node_hostname_here}
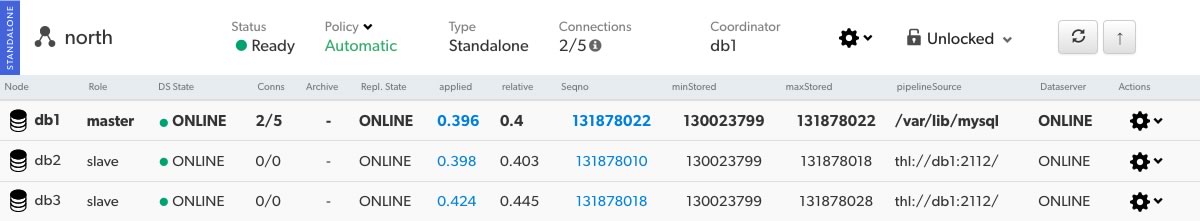
All of the controls and information are the same for Standalone clusters and nodes as they are for Composite with the following exceptions:
A Standalone Cluster is not part of a Composite.
There will be no Composite commands in the service-level dropdown menu.