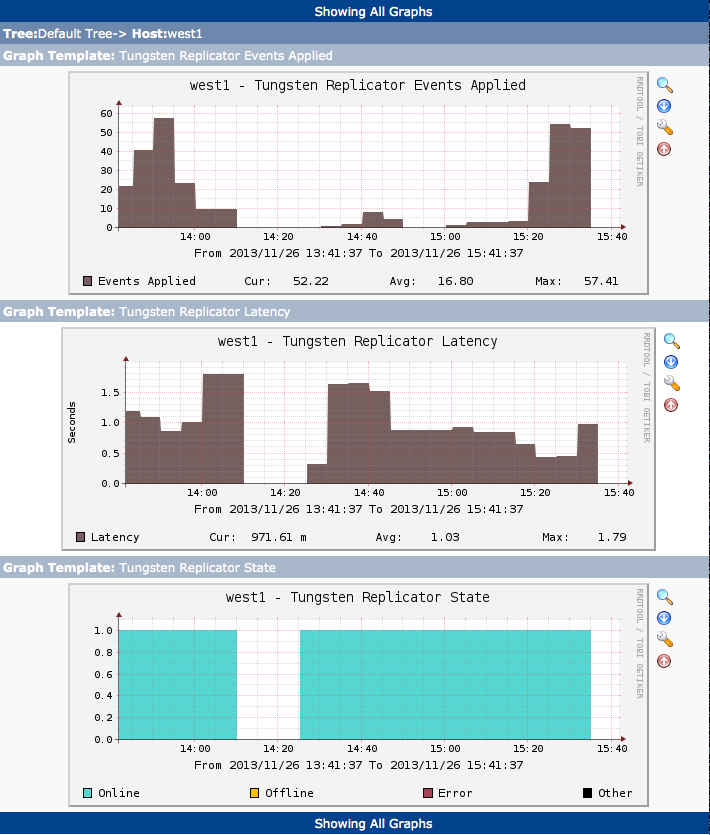
Graphing Tungsten Replicator data is supported through Cacti extensions. These provide information gathering for the following data points:
Applied Latency
Sequence Number (Events applied)
Status (Online, Offline, Error, or Other)
To configure the Cacti services:
Download both files from https://github.com/continuent/monitoring/tree/master/cacti
Place the PHP script into
/usr/share/cacti/scripts.Modify the installed PHP file with the appropriate
$ssh_userand$tungsten_homelocation from your installation:$ssh_usershould match theuserused during installation.$tungsten_homeis the installation directory and thetungstensubdirectory. For example, if you have installed into/opt/continuent, use/opt/continuent/tungsten.
Add SSH arguments to specify the correct
id_rsafile if needed.Ensure that the configured
$ssh_userhas the correct SSH authorized keys to login to the server or servers being monitored. The user must also have the correct permissions and rights to write to the cache directory.Test the script by running it by hand:
shell>
php -q /usr/share/cacti/scripts/get_replicator_stats.php --hostnamereplserverIf you are using multiple replication services, add
--serviceto the command.servicenameImport the XML file as a Cacti template.
Add the desired graphs to your servers running Tungsten Cluster. If you are using multiple replications services, you'll need to specify the desired service to graph. A graph must be added for each individual replication service.
Once configured, graphs can be used to display the activity and availability.