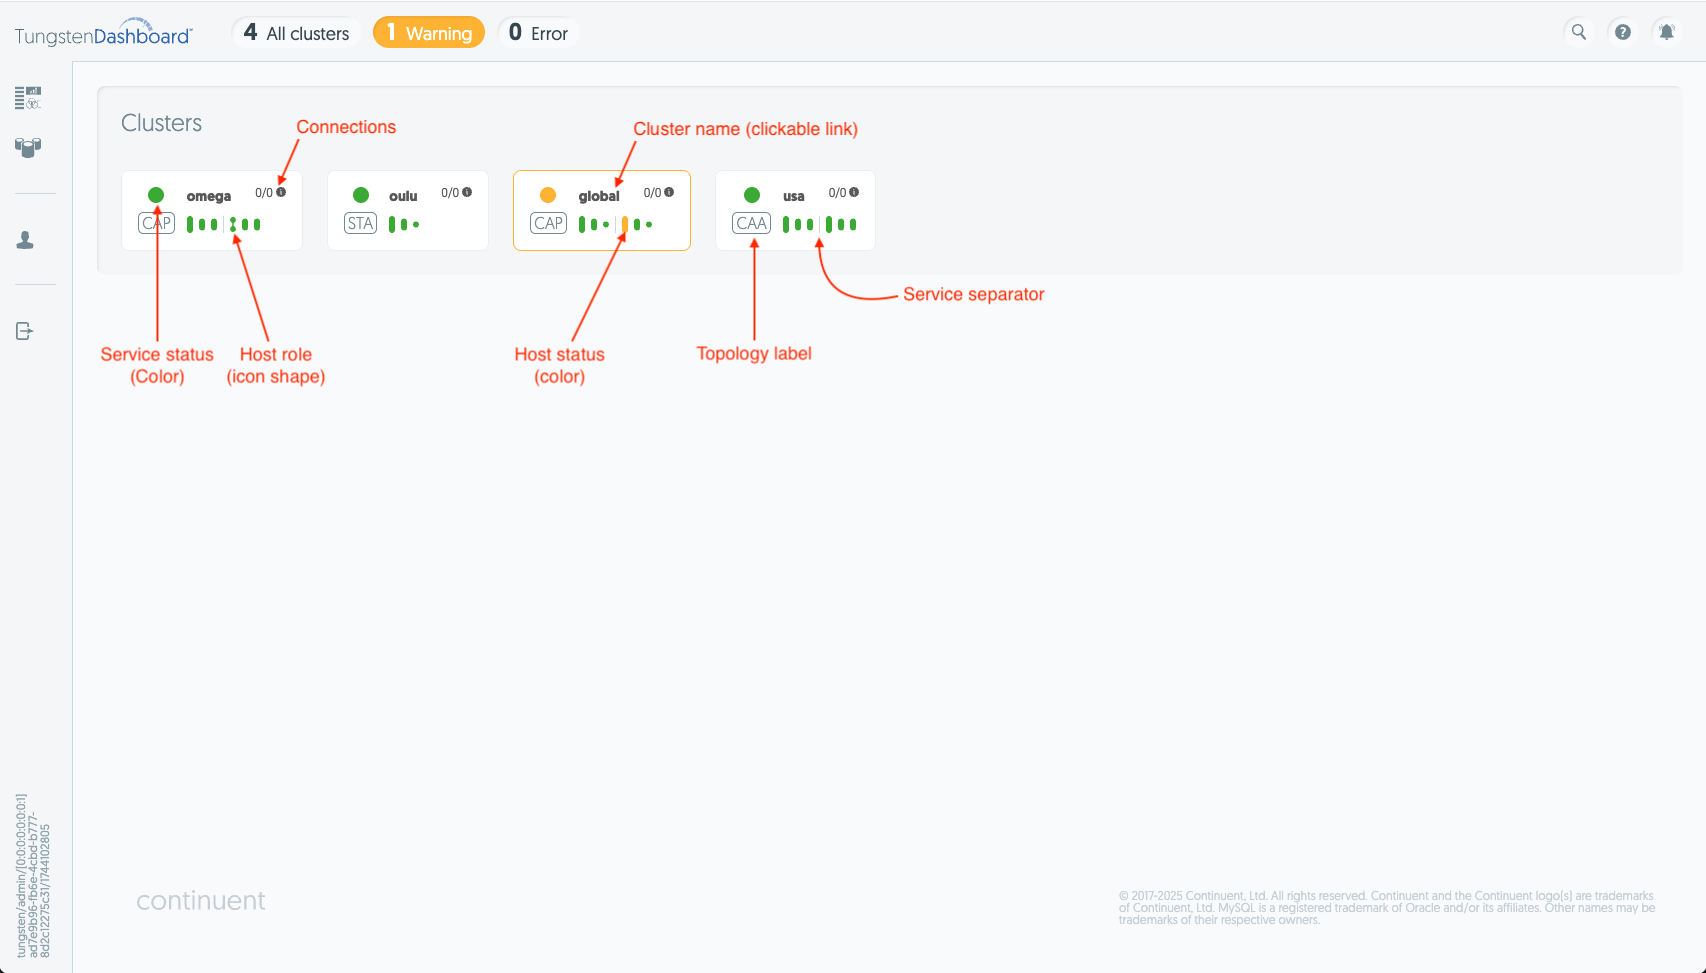
Front Page Interface
From this page you can find a quick status overview of any of the clusters you have connected the Dashboard to. Clusters are split into small "widgets" on the page.
Each widget shows:
-
Status of the service with in the border and status icon color
- Green - ok
- Yellow - warning
- Red - error
-
A clickable cluster name that takes you to the Clusters page to see more details about that cluster
-
The number of connections to each cluster broken down by host
-
The topology of the cluster:
- STA - Standalone
- CAP - Composite Active/Passive
- CAA - Composite Active/Active
- DAA - Composite Dynamic Active/Active
-
The role of the nodes for each cluster are indicated by the icon size:
- The full-size icon indicates a "Primary" node
- The medium-sized icon is a "Replica" node
- The small dot is a "Witness" node
Refer to the help overlay of the Dashboard for a break-down of the icon information or Tungsten Cluster documentation for a breakdown of the roles.
-
Each service for a composite cluster is separated by a small vertical line in this widget.